- Figure 2 is a more explicit representation of the long-run supply curve as we work to provide the world with 96 million barrels of oil per day.[2] The first reserves developed are the least expensive, from the on-shore Middle East at $10-$25 per barrel, then the Offshore Shelf at $40, and then from a variety of sources that keep price near $50 until we need 85 million barrels per day. Then the price to bring on new supplies rises rapidly, with U.S. shale at $65, oil sands at $70 and Artic oil at $75. These marginal suppliers all find themselves on the cusp of the 96.3 million barrels produced in 2015. Looking back, it is hard to imagine the long-run price of oil slipping under $50. Looking forward, global growth in demand at 1.0 to 1.5 million barrels per year will require higher prices near $65-$70.
Saturday, 16 December 2017
oil and gas equilibrium


Friday, 15 December 2017
MARKET EQUILIBRIUM AND GOVERNMENT INTERVENTION
MARKET EQUILIBRIUM
DEFINITION
The quantity in which producers are willing to produce and the consumers are willing and able to purchase.
QUANTITY DEMANDED = QUANTITY SUPPLIED
DETERMINATION OF EQUILIBRIUM PRICE AND QUANTITY
- From demand and supply schedules
- From demand and supply curves

DEFINITION OF GOVERNMENT INTERVENTION
The imposition of certain directives by the government,which interferes with the market mechanism.
TYPES OF INTERVENTION
- Price control(price floor or minimum price and price ceiling or maximum price)
- Indirect tax and subsidy
a)Minimum price(price floor)
- imposed by the government when market price is extremely low
- Where government help push up the price(agricultural products)
- At minimum price,supply exceeds demand:therefore,its creates SURPLUS.

ADVANTAGES
=Higher income for FARMERS
DISADVANTAGES
- Consumers have to pay higher price
- The problem of surplus.Government has to buy the excess stock by using taxpayers money
- The excess stock has to be disposed-causes wastage.
- imposed by the government when market price is exorbitantly high
- usually imposed during inflation or war
- at maximum price,demand exceeds supply:therefore,it creates SHORTAGE.

ADVANTAGES
Consumers pay lower price
DISADVANTAGES
- Due to the problem of shortage,people are willing to pay higher price.This encourages black market and smuggling activities.
- Since limited supply,government has to ratio or redistribute
- Encourages exploitation by the producers.


DIRECT TAX
Imposed directly on to a person(income tax,company tax).
INDIRECT TAX
Imposed on an entity but that entity can shift the burden of paying tax to someone else(sales tax,import tax).
EFFECTS OF IMPOSING INDIRECT TAXES ON GOODS
The imposition of indirect tax will cause the producer to reduce supply.Therefore,supply curve will shift to the left(Supply without tax -->Supply with tax). As a result,price goes up and quantity reduced.

Wednesday, 13 December 2017
Elasticity
FORMULA
DEGREE OF PRICE ELASTICITY OF SUPPLY
DEGREE
|
DESCRIPTION
|
VALUE OF COEFFICIENT
|
SLOPE OF SUPPLY CURVE
|
ELASTIC
|
%CHANGE Qs > %CHANGE P
|
SUPPLY ELASTICITY > 1
|
 |
INELASTIC
|
%CHANGE Qs < %CHANGE P
|
SUPPLY ELASTICITY < 1
|
 |
UNITARY
|
%CHANGE Qs = %CHANGE P
|
SUPPLY ELASTICITY = 1
|
|
PERFECTLY ELASTIC
|
AT LEVEL P,Qs is infinity
|
SUPPLY ELASTICITY = INFINITY
|
|
PERFECTLY INELASTIC
|
NO CHANGE IN Qs ALTHOUGH P CHANGES
|
SUPPLY ELASTICITY = 0
|
example for Tesco bread
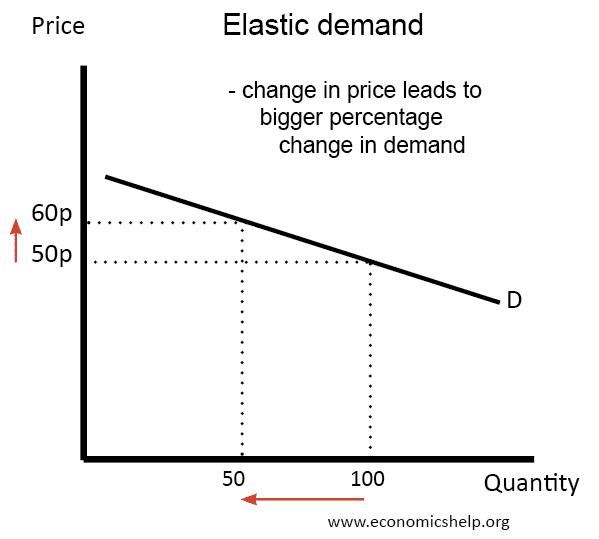

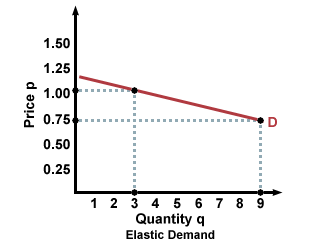
inelastic demand
- for petrol
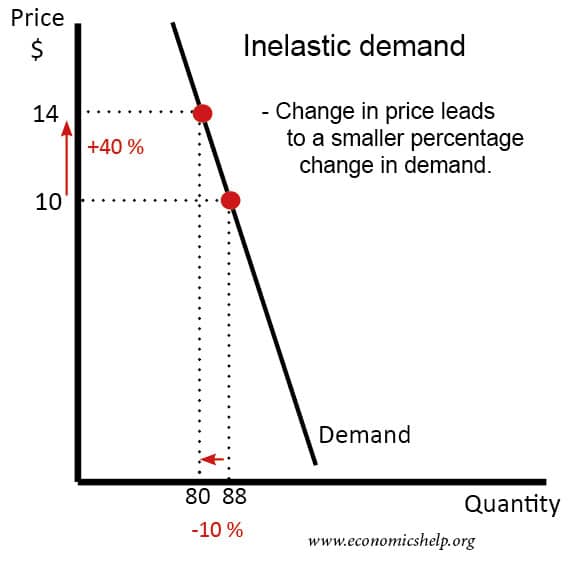
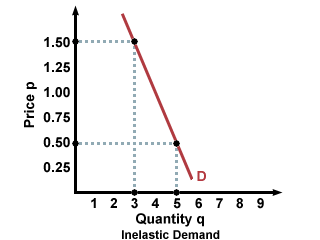
petrol has few alternatives because people with a car need to buy petrol. For many driving is a necessity. There are weak substitutes, such as train, walking and the bus. But, generally, if the price of petrol goes up, demand proves very inelastic.


Given the following data for the supply and demand of movie tickets, calculate the price elasticity of supply when the price changes from $9.00 to $10.00.

We know that the original price is $9 and the new price is $10, so we have Price (Old) =$9 and Price (New) = $10. From the chart, we see that the quantity supplied when the price is $9 is 75 and when the price is $10 is 105.
So we have:
Price (Old) = $9
Price (New) = $10
Price (New) = $10
Quantity Supplied (Old) = 75
Quantity Supplied (New) = 105
Subscribe to:
Posts (Atom)